
All kinds of requirements are placed on SAP Business One reporting by users after the introduction of SAP B1. Rich reports based on integrated data management are usually at the top of the list of requirements for a SAP Business One reporting system. SAP Business One - Introduction. SBO users have various options and tools at their disposal for such reports.
Many ways to obtain reports for SAP B1

Reports for SAP Business One can be generated inside or outside the application. There are various Add ons for SAP Business One reporting or extensions with your own tools. In addition, you can also use a number of tools from the SAP world that are not or not only provided for SAP Business One. It is not only important how reports are generated for SAP Business One. The provision, control, distribution and automation of reporting are also important features.
SAP Business One Reporting starts in the programme
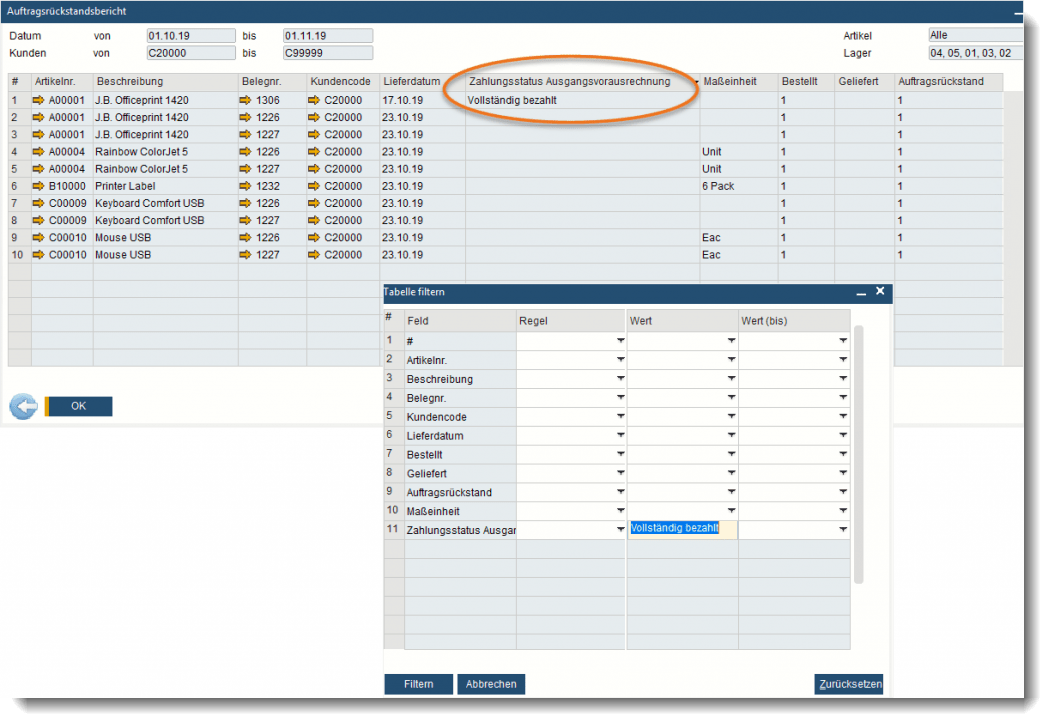
SAP Business One report with filterSAP B1 already reports a great deal to its users without them having to use any additional tools for reporting. Standardised tabular views of a module's data can be found in abundance in SBO. These can then be exported to Excel or other formats such as Word or PDF. Such tabular views can also be the results of user-defined queries on the database or a product from Drag & Relate be. The result is often sufficient as a quick source of information for the user. The advantage of viewing a report in SAP Business One is that you can use the orange arrow to jump to the next level of information. However, you can also filter the report directly and generate a quick data extract. It is therefore worth using the standard reports, queries and report functions when looking for an overview in SBO.
Pervasive analytics in SAP Business One

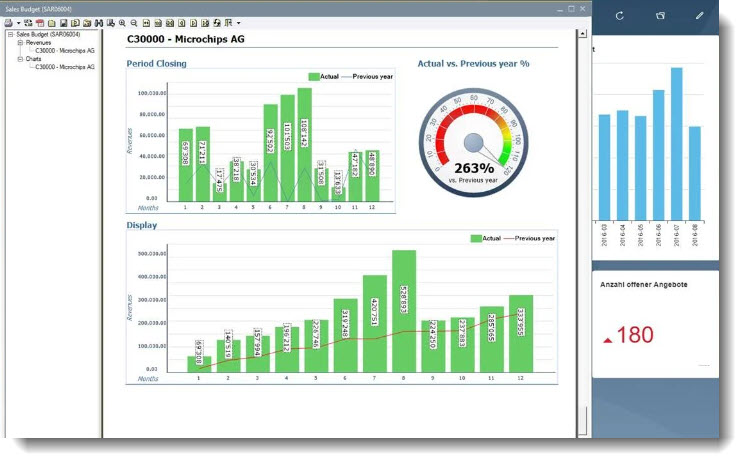
SAP Business One Pervasive Analytics DesignerSAP Business One offers a powerful and easy-to-use analysis tool as standard - the Pervasive Analytics Designer. The solution enables key performance indicators (KPI) and two Dashboard-Generate and edit types: Pervasive and Advanced. The views generated in this way can then be displayed in the user's cockpit depending on their rights and preferences. The aim is to provide a quick overview and constant control of relevant company figures.
MS Excel Interactive Analysis reports
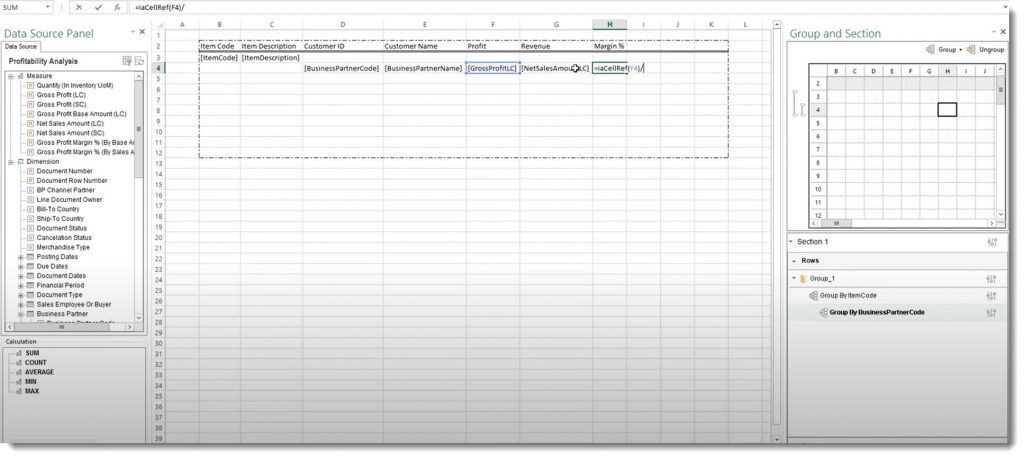
The MS Excel pivot table can be used to interactively analyse business data and draw new insights from it. MS Excel can also be used to create a customised report that is closely integrated with SAP Business One. The data from SAP HANA-models (semantic layers) and then expand, calculate and edit them. The Excel Report Designer tool also offers numerous chart options for visualising data sets, including dimensions and key figures, grouping and filter options as well as parameter definitions.
SAP Crystal Reports

Crystal Reports SAP Business OneWith the business intelligence (BI) tool SAP Crystal Reports, analytical reports from SAP and non-SAP data sources such as SQL ServerMySQL, XML data sources, MS Excel and more. It is a standard reporting tool for the SAP Business One database on MS SQL and SAP HANA platforms. Within SAP Business One, Crystal Reports provides a free designer licence and allows a single installation on a workstation if you have licensed SAP Business One or the SAP Business One version for HANA. This license can only be used in combination with SAP Business One or add-ons. Additional Designer licences can be purchased. No viewer licences are required to display forms or reports. Crystal Dashboard Design and Runtimes are also included. This enables the user to visualise the data contained in the system in sophisticated, dynamic reports.
Exports with SAP Crystal Reports for SAP Business One
Analyses can be published in a wide range of different file formats. These include MS Word and MS Excel. The reports can be sent directly by e-mail or published on the Internet. The extended report generation via the web enables other users in a group to view and edit the analyses via the browser.
Crystal Dashboard Designer for SAP B1

Crystal Report DashboardWith Crystal Dashboard Design, SAP Business One users can create customised dashboards and reports - without any programming. SAP Business One comes with a ready-to-use dashboard that immediately provides an overview of the most important company data. You can also create your own interactive dashboards.
Coresuite Country Package
core suite designer for SAP B1The coresuite country package is certainly already a veteran among the add-ons for SAP Business One, but it is still highly relevant in terms of reporting. In terms of usability and features, it can outperform SAP's own solutions in some areas. It also comes piggybacked with a number of standard reports that you won't find in the SAP B1 standard.
The coresuite designer can be opened directly from SAP Business One. This allows the report creator to check the field data (column name) directly in SBO at any time. A number of auxiliary functions are available with the coresuite designer, including Simple Scripting (vb.net/c#) with code completion and highlighting, simple charts, extensive reports with subreports, pivot tables, charts, RTF text, barcodes, Graphics and .net scripting
The coresuite designer can be used to create not only tables, but also charts and instrument analyses. The pivot element can also be used for reporting (OLAP).
The pivot object collects data in several dimensions. It is also possible to create more complex constructions by implementing any number of levels. A number of special functions are available in the pivot table to facilitate the calculation.
Sophisticated functions for printer control and e-mailing complete the picture.
MS - Power Bi for SAP Business One

MS Power BI for SAP Business OneMicrosoft Power BI is a collection of business intelligence tools Software as a Service (SAAS) be made available. With Power BI, company data can be analysed in the cloud, the results provided in graphical form and easily shared with others on any end device.
Various databases, web services and files can be used as data suppliers. The Power BI system ensures that the latest data from the various data sources is always displayed and formatted correctly. Various gateways are available for the integration of local or cloud databases.
With Versino Power Bi Integration, all the important SAP Business One data structures are available so that you can start analysing immediately. The resulting interactive reports based on your SAP Business One data can be accessed from SAP B1, on the web, mobile or from your Office 365 account. The Power BI Embedded service also allows the integration of special applications.

Trial Balance in SAP Business One: What the Versino Financial Suite does differently – and why tax advisors notice
Crystal Reports on AI
IFRS & HGB with SAP Business One
Financial statementsFinancial statements
SAP Business One - Reporting