
SAP Business One has had sophisticated functionalities for creating dashboards since version 9 at the latest. But also MARIProject, integrated project software based on SAP B1, has a lot to offer here in terms of creating a dashboard.
What is a dashboard
The term dashboard actually stands for "dashboard". In information technology, dashboards are graphical interfaces, i.e. a collection of different graphic elements that are used to display certain data or to control applications.
Dashboards in Controlling
Dashboards have their preferred areas of application in the area of controlling. Their function is to make various types of key figures and performance indicators (KPIs) transparent. Business decisions can then be derived on the basis of this data. Some possible applications:
- Monitoring of key figures from the finance (e.g. Cash flow)
- Comparison of target and actual values (e.g. sales, contribution margin)
- Display of warehouse key figures (e.g. running time and delivery range)
- Production control (e.g. current capacity utilisation and effectiveness of the systems)
Nature and advantages
Dashboards are created from upstream systems such as ERP, BI and new data stores. One of the main advantages of today's dashboard solutions is that users can Interfaces can create themselves. Different graphic elements such as traffic lights, speedometers and graphs are often available.
Dashboards allow professionals of all kinds to monitor performance, generate reports and set estimates and targets for future work.
This results in the following advantages
- A visual representation of the performance, e.g. with charts and graphs
- The ability to recognise trends
- a simple way to measure efficiency
- the ability to create detailed reports with a single click
- The ability to make more informed decisions
- Complete overview of all systems, campaigns and actions
- Quick identification of data outliers and correlations
Dashboards in MARIProject
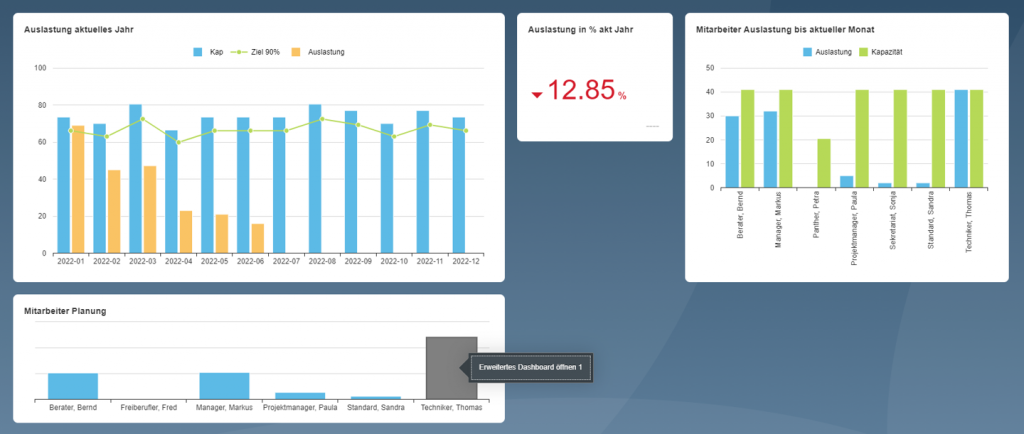
With MARIProject, it is possible to combine different key figures and analyses for a project in a project dashboard.
Similar to the SAP Business One cockpit, the key figures and analyses for the selected project are displayed graphically. There are metrics such as "percentage of completion" or "Open receivables" and analyses such as "Recorded times per employee" or "Comparison of recorded and planned times" are possible.
In the project dashboard, it is also possible to select the chart type, e.g. bar or line chart, for a specific period such as "January to December 2018".
")

Video: MariProject Customer Service
MARIProject plans with dependencies
All requirements of the Support Desk fulfilled
On assembly with SAP Business One
Why service needs a different ERP